The anatomy of plant design and the OT cyber-attack – Part 2

In Part 1, I discussed the design processes and the disciplines that influence the OT security design process, additionally, I introduced the “first law of OT cyber security”. In this second part, I zoom in on the anatomy of the OT cyber-attack discussing how this relates to the design process. And I will discuss the use of quantitative risk in cyber security design, a controversial topic addressed by many as “not possible”.
But first, let’s define what I consider an OT cyber-attack in the context of this article:
“An OT cyber-attack is an attack, using cyberspace, that targets a manufacturing plant’s process automation system with the aim of disrupting, disabling, damaging, or maliciously controlling its production process and installation”.
With this definition, I ignore the potential disruption of the business functions that are resident in the corporate network as a consequence of their reliance on the process automation system the information (or reverse).
My focus in this article will be on the attack scenarios that attempt to damage the production unit and cause loss of containment, or explosions. My imaginary target will be a process unit with its equipment modules in a petrochemical plant. For readers without a process engineering background, engineers decompose a chemical plant into units (e.g. a reactor), equipment modules (e.g. a pump), and control modules (e.g. a pressure control loop). These equipment modules have a typical configuration whose process risks and solutions are often solved in a similar way. Looking at the P&ID (Piping and instrumentation drawing) of a unit we can quickly spot the hazards that a cyber-attacker can attempt to exploit.
As usual, I try to approach the OT security design task from a holistic point of view, identifying the hazards to the production process and look for a solution by combining the OT security design task with the results of the process design and security design tasks. The safety design in particular plays a key role here. When starting the design process the first set of questions to ask are: How does it work? What can go wrong? What will happen? How can we prevent this? How can we limit the damage?
Let’s start the discussion by discussing the model of an OT cyber-attack. For this I created Figure 2, I start at the left side of the diagram with the threat actors.
For a successful attack, a threat actor must have the intent to attack; the technical capability to accomplish the attack; and the opportunity to carry out the attack. If one of these three factors is missing, the threat actor will not succeed.
Threat actors differ very much in skills, available resources, opportunity, and motive.
For example, threat actors can be insiders with direct access to the process automation systems or outsiders who have to find other routes to the process automation system, for example using the network connectivity.
Insiders can have access to critical information such as network addresses, topology drawings, account names, and sometimes even account passwords. Furthermore, we can differentiate threat actors based on their skills, motives, and access to resources.
We call this process threat profiling. Studying an adversary’s motivations and methods. Threat profiling is the first step in designing a cyberattack-resistant automation system. It is always important to know against which category of threat actors we defend the systems. There is a big difference between whether we have to defend ourselves against insider attackers and attacks from state actors, or whether we can design our security defenses based on non-state actors such as cybercriminals and hacktivists.
Another difference is the target, for example, if the potential target is part of the national critical infrastructure, such as a gas pipeline, or if the target is a non-strategic plant. Other factors such as the geographical location where the plant resides also make a distinction. The number of historical occurrences of OT cyber-attacks in a specific industry sector differs by geographical location.
We need to collect and analyze this information to understand which threat actions are within the capabilities of the threat actor and what type of vulnerabilities are exposed to the threat actor to exploit. Figure 2 shows 4 threat actors, in real life risk analysts typically use at least 8 categories.
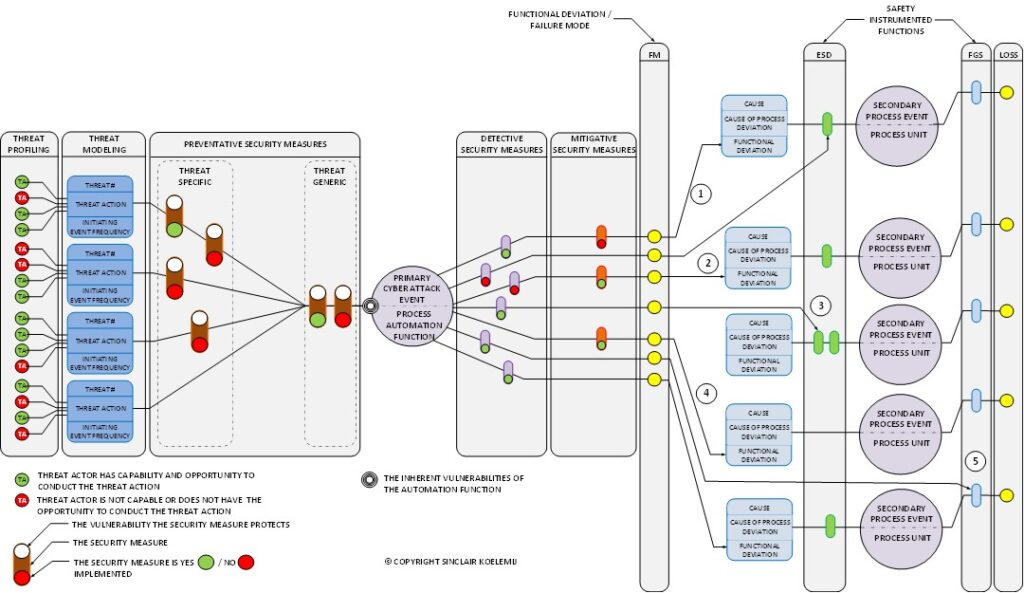
Threat actors carry out attack actions, the tactics, techniques, and procedures (TTP) of their trade. Because of their difference in skills, resources, and difference in “contact frequency” with the system, they select different threat actions. This is represented in the drawing by the red and green circles, green means the threat actor has the skills and abilities, and red means he cannot or would not use this threat action.
The threat actions exploit the vulnerabilities of the target, shown as a set of concentric circles. The threat actions are defined at a functional level, and can in principle exploit multiple vulnerabilities. For example, the threat actors can be message injection, a method that can exploit multiple vulnerabilities. Each vulnerability is protected by a security measure, in general, we need multiple security measures to stop an OT cyber-attack. From a risk perspective, security measures can be yes (Green circle) /no (Red circle) implemented. By “switching” them on and off, a risk estimate can investigate multiple defense strategies.
To the left of the top event (the circle in the middle), we have preventative security measures, these reduce the chance of success.
If we consider the event frequency of the threat action, together with the risk reduction of the preventive security measures, and the different risk factors that determine the static and dynamic exposure, we can estimate an event frequency that the security resilience of the target represents.
Security measures in this context are not only the external add-on security controls such as firewalls and malware protection but also include the many configuration settings in the target that protect the system, for example, various read/write protection settings.
Several security measures are often combined in a single security control, for example, a next-generation firewall would typically contain multiple security measures. The target is an element of a process automation function, for example, an operator station or a controller. A top event can be something like “unauthorized access into the operator station”. The various threat actions describe how this can be accomplished, which threat actors can use what TTP to do this, and what security measures can stop this. An OT security design is a combination of typical security controls also used in IT systems and a range of automation design choices and settings that reduce risk.
In the diagram, the detective controls are shown at the right side of the top event. Some detective controls can also have a preventative function if used in combination with an automatic response (e.g. in an IPS) so could also be positioned on the left side. I wanted to make a choice to put them on the right side. Further, we have the mitigative security measures on the right side, these security measures reduce the consequence severity. They act after the security breach, an example is a backup.
More important are the yellow circles in the drawing indicating the technical consequences, and the functional deviations in the target as a consequence of the OT cyber-attack.
Each target has a defined set of functions, for example, it is not likely that a process controller will certainly become a micro-wave as a result of the OT cyber-attack, it remains a process controller but will no longer perform meeting design or operational intent.
The consequences need to be defined at a level where they can be linked to process causes identified in the process safety HAZOP / LOPA.
A consequence such as loss of control is thus a useless impact for detailed risk analysis. Loss of control window integrity, loss of automated control performance, loss of control integrity, loss of alarm, loss of command integrity are more aligned with the functionality a process controller provides and can be associated with a process cause as identified by the process safety analysis.
We call these failure modes, different automation functions and their components have different failure modes. The failure modes of a process controller and a PLC overlap but also differ at essential points. Failure modes differ for automation functions, even sometimes differ per vendor for the same function. But failure modes allow us to structure the various technical deviations which can later use when analyzing the risk register.
Not every threat action can cause every functional deviation, this depends on the definition of the top event. A top event such as “unauthorized access into an engineering station” has different functional deviations for similar threat actions as a top event such as “ unauthorized access into a 24×7 attended operator station” would have. This is because they have a different task, though both might essentially be a Microsoft desktop computer. A top event such as “ unauthorized access into an unattended operator station” could have other controls defined.
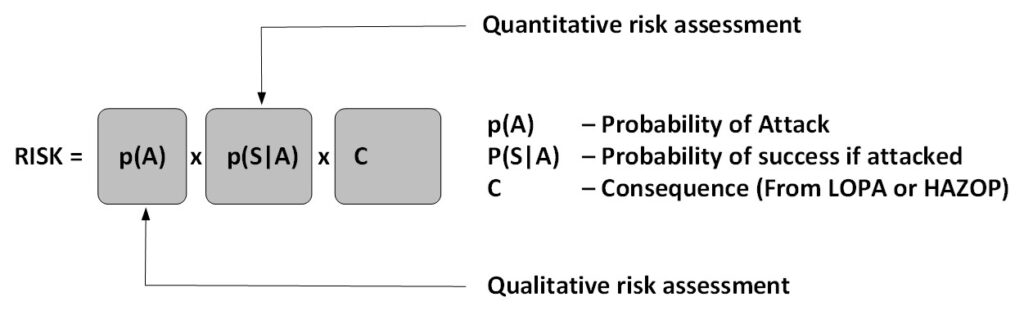
Also, the security measures can differ, static and dynamic exposure can differ, so overall the same set of threat actions results in a different likelihood. Risk is expressed as likelihood times consequence (See Figure 3), where the likelihood is expressed as p(A) x p(S|A) and actually is estimated as an event frequency, not necessarily a probability. The formula is also used to determine terrorism risk. This formula has the advantage that we can treat the threat actor differently than the cyber resilience of the function.
Event frequency can be converted into a probability if we need this. For example, if we have an event frequency of 1 time in thousand years that will give a probability that the event will happen within the coming 10 years of 0.01. The 10-year period is an example, we typically use a time period matching the life expectancy of the system function. I discuss the use of probability at the end of the article when we discuss single-step and multi-step scenarios.
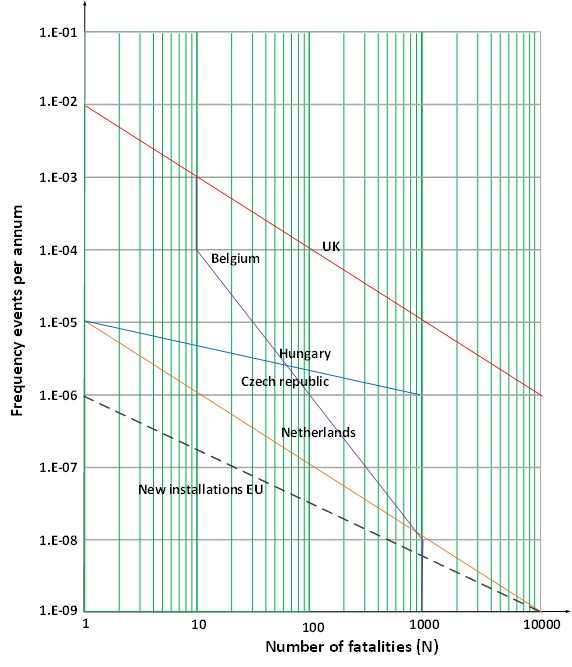
Event frequencies have been defined by the government for different types of impact, there are criteria for individual risk (workers within the plant, societal risk (public outside the plant’s fence), and environmental risk. Governments do this to limit risk.
In Figure 4, some examples are shown for European countries, in this case for the individual risk criteria. Process safety defines what is called the target mitigated event likelihood, the maximum event frequency for a specific impact level. These criteria are derived from these regulatory criteria and corporate policy.
They differ per country, they differ per risk type, and they differ per company. Nevertheless, according to the 1st OT cyber law discussed in PART 1, the security design needs to meet these criteria since the incidents as result of a process automation failure can result in fatalities in the petrochemical and oil & gas industry.
If we step back to the cyber-attack anatomy in Figure 2 we can see that the functional deviations resulting from the cyber-attack can be associated with either the cause or the safeguard of the LOPA / HAZOP analysis. There are multiple attack scenarios possible, I numbered them in the drawing (Figure 2) from 1 to 5:
- This is the scenario where the attack needs to target two functions to cause the issue, for example, the basic process control system (BPCS) and the safety instrumented system (SIS). The first is to cause the hazardous process situation (attacking the BPCS) and the second is to prevent the SIS to intervene.
- This is the scenario where an attack on a single function, for example, the BPCS, would be sufficient to cause the damage. This can sometimes be as simple as intercepting all alarms. Those are usually configured as a separate service with a specific TCP address, so a simple ARP poisoning attack that creates a sinkhole for this traffic would suffice.
- In scenario 3 we attack the SIS, the emergency shutdown (ESD) function. Also, the SIS has control over critical valves that can cause damage. For example, a breached SIS could close an emergency isolation valve at the suction side of a pump without stopping the pump. As such damaging the pump.
- There are also cases where the SIS doesn’t intervene, normally not for process scenarios involving fatalities but still scenarios that can result in serious damage. For example, modifying an interlock mechanism in the BPCS or modifying a process analyzer value that represents the oxygen content in the material. If the oxygen ratio would become too high, this can lead to an explosion.
- This scenario attacks the fire and gas (FGS) controller. FGS is used to detect either toxic or explosive vapors and mitigate the problem. Gas detection sensors are for example placed around pumps because these are a common source of leaking seals. If the FGS would detect a leak it can stop the pump and the feed to the leak. However, an attack might alter these actions.
The above 5 scenarios are the most common scenarios that can be used by a cyber-attack, but there are some other less obvious scenarios as well.
In the above text, we constructed cyber-attack scenarios for a specific hazard/function and linked these to the HAZOP / LOPA process safety scenarios. We call these scenarios loss scenarios, because these scenarios specify a specific loss when this scenario would develop. The likelihood of this scenario is no longer the process safety likelihood based on random failure but will now be the likelihood of the cyber-attack scenario caused by intentional action. The consequence (the loss) is derived from the HAZOP / LOPA documents.
We ignored the impact of a cyber-attack on the business functions, if we would have included this in the risk assessment scope we would also need loss scenarios for this part of the design.
You might have noticed that all cyber-attacks have been defined as a hazard of a single function. The idea is that if all functions comply with the risk criteria, the resulting overall estimated event rate (or probability) also meets the requirements for the process automation system.
Unfortunately, it is seldom that all components meet the criteria. There will always be functions/components that fail the criteria. For example, in Figure 5 we show in an abstract way all these cyber hazards with their threat actions and consequences. The field equipment has few security measures to offer, we can set a tamper proofread/write protection but this is all. The field equipment, sensors, and actuators are typically not strong in protecting themselves. The only way to protect this equipment is if we reduce their exposure such that access to these functions can only take place through stronger protected functions that do meet the criteria.
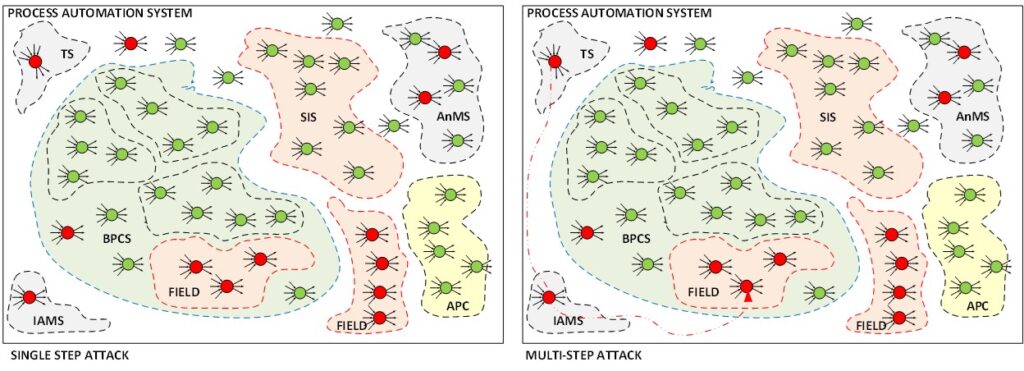
In those cases, single-step analysis is no longer possible and we need to consider multi-step attacks, and cyber-attacks that step by step enters the system.
In the example of Figure 5 (right diagram) the point where a vulnerable terminal server (TS) is exploited and can be used as a platform to attack the next hop in the scenario, in the example the next hop would be the instrument assessment system (IAMS) that manages the field equipment. If that second step succeeds we can get from there to the field equipment and possibly cause a process deviation that results in the loss scenario we were analyzing.
In this case, we need to start using probabilities, because we need to estimate the conditional probability that all steps in the scenario are successful. The conditional probability in this case is the product of the probabilities of each step. That is if each attack (each event) is independent and disjoint. There are also scenarios where this is not the case, where we have dependent events (so the probability of the next step is influenced by the probability of the previous step) but I leave that level of detail to another article. The objective of this two-part article is to show that OT cyber security is far more than configuring firewalls.
For now, the message is that when we build a plant and need to secure it, we need to build a risk register to analyze the various aspects. Such a risk register is the compilation of loss scenarios that we can analyze in many ways. Typically thousands of scenarios if we consider all the variations caused by the number of threat actors, threat actions, vulnerabilities, and consequences.
When we have a risk register, we can group threat actors and check risk for a specific threat actor group, we can group risk per process automation function, or a combination of functions (for example to analyze control system ó safety system integration ), we could look at specific types of TTP, any many more.
This of course is no manual design effort and requires tooling to create such a risk register, but the result provides a wealth of information that can be used to make the right security design decisions based on actual loss scenarios. So justifiable.

A complimentary guide to the who`s who in industrial cybersecurity tech & solutions
Free DownloadRelated