Stop surfing “solution hypes”, and start OT security engineering

As usual, my blogs are about the process of cyber security engineering, a proper understanding of the cyber security engineering process provides a much sounder foundation for a cyber secure process automation system than any “miracle” solution does. Engineering must be done from a concept and risk management provides this concept. So this time a blog on cyber-physical risk assessment, how it is applied, and how parts of our community forgot to track the new developments in this discipline.
Establishing tolerable levels of cyber-physical risk is one of the most contentious and important risk management tasks. Most regulatory or budgetary decisions related to the mitigation of a potential loss are part of a risk management program.
Society, private companies, or a petrochemical plant need to decide whether or not a specific risk is admissible, but how do they do this? The shortest answer is, that they conduct a risk assessment.
Unfortunately, this answer leads to a series of new questions, as there are multiple approaches to conducting a risk assessment. The concept of risk and risk assessments dates back to the ancient Greeks, more than 2400 years ago. While the principles have not changed much since the beginning, the methods of assessing and assessing risk have changed considerably. There are many different methods because we often have to adapt the method to the problem we are trying to solve.
The reference is the IEC / FDIS 31010 standard on risk management and risk assessment techniques. But this is certainly not the only reference, there are many technical reports some of them very specific for the industry, that provides good information on how to assess risk. The basic model for a risk management process is:
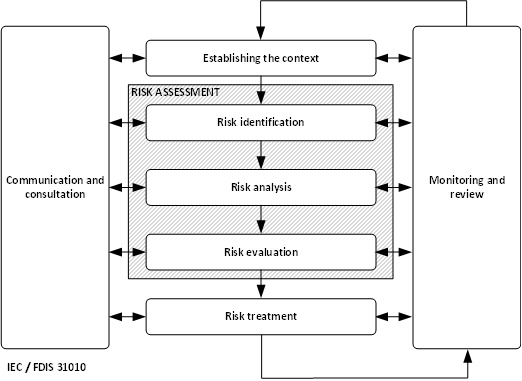
In particular, the first task, establishing context, is an interesting step in operational technology (OT) risk assessments. This first task determines the scope and criteria for the risk assessment. For a risk assessment in a petrochemical plant or refinery, this is much more than creating an up-to-date architecture in combination with an inventory of the automation systems and any external services. We need to identify what in the theory of risk analysis is called the risk-absorbing system. There are three different risk “domains” depending on how we define the risk-absorbing system.
In the next figure I show these three risk domains:
Type 1 – In this case, the risk absorbing system is the process automation system or IACS (Industrial Automation Control System) as IEC 62443 calls it. The cyber security threat targets the various assets (servers, stations, controllers, network equipment, …) and channels (communication protocols: Modbus, OPC, HART IP, proprietary protocols, …) of the IACS. The consequence is a functional deviation (I ignore for the moment confidentiality impact), a deviation in operational or design intent. The system behaves differently as expected, or stopped functioning. I call this technical risk, a type of risk that ignores loss scenarios, and consequences for the business or process installation/production process.
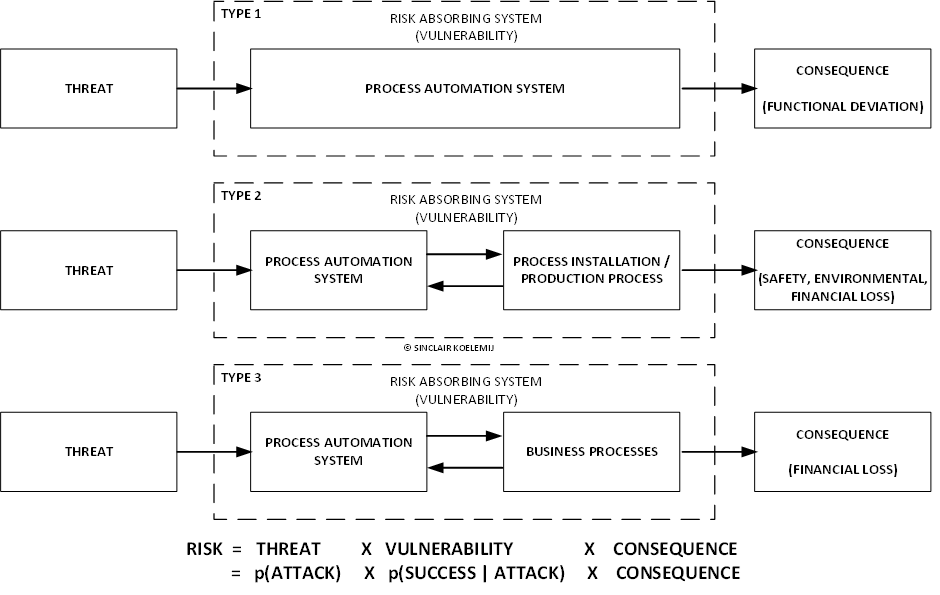
Type 2 – In this case, the risk absorbing system combines the process automation system and the process installation/production process. So it extends technical risk (type 1) into cyber-physical risk (type 2). In this risk domain, we consider how the process installation and production process respond to the functional deviations resulting from the cyber-attack. For example the functional deviation in a process controller or PLC that causes the cool water pump to stop or closes the cool water valve. The loss scenario describes what will happen if there is no cool water and what the worst-case consequence will be. This is called cyber-physical risk, typical consequences are damage to human health, environmental damage, or financial damage. But other damage categories are also considered such as company image or how the damage impacts “downstream” or “upstream” stakeholders.
Type 3 – In this case, the risk absorbing system combines the process automation system and the corporate business processes that rely on data from the process automation system, or the reverse where the process automation system relies on data from the corporate systems. This data can be manipulated by a cyber-attack or can be blocked, both can have significant financial or regulatory consequences. This is called business risk.
Companies define and communicate risk criteria to manage the risk. In principle a corporate risk management system would cover all aspects of risk, so for a plant, this also includes reliability risk, process safety risk, and today cyber security risk. This last part, cyber security risk, splits into IT risk and OT risk. Where OT risk can be split into the 3 risk domains discussed. Risk management should follow a holistic approach to risk, independent of the risk agent. It is the level of loss and risk category (human health, environment, finance) that sets what risk tolerance is considered appropriate by the company. The cause is not relevant to the risk tolerance limits, a loss caused by a cyber-attack is weighed just as heavily as a loss caused by a process safety incident. The next diagram shows an example of risk criteria as used for both process safety as well as cyber-physical risk. The number of impact categories and event likelihood ranges can differ, but the principle is as shown in the diagram.
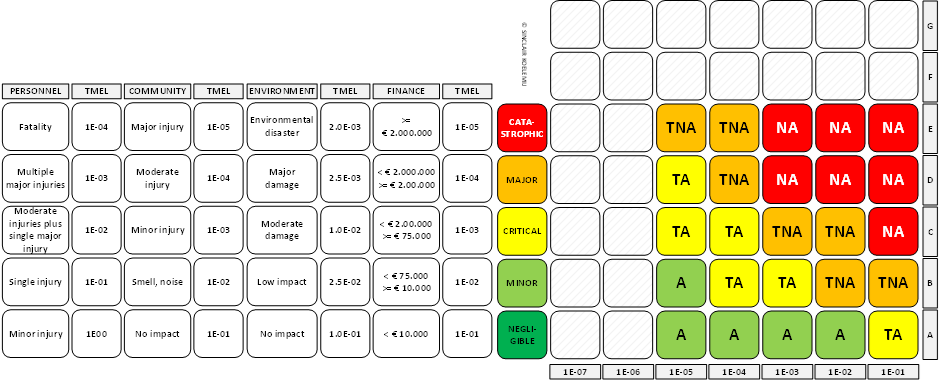
The criteria for the categories: personnel (individual risk), community (social risk), and environment normally have a legal basis. The regulations set limits in the form of F-N curves, specifying a maximum annual event frequency for a specific loss event (for example a fatality or environmental damage). The corporate limits are expressed in the risk criteria as “target mitigated event likelihoods” (TMEL), an upper limit for all events leading to this level of impact. But risk criteria define more, different companies maintain different risk capacity criteria. Risk capacity is the area in an F-N curve between the risk tolerance limit and the risk appetite level. A smaller risk capacity generally means less defense in depth, the risk can change quickly from an acceptable level to a not acceptable level.
Type 1 risk assessments express risk as either a nominal value (qualitative) or a risk priority number (RPN), a number that can be used to indicate which risk is higher but has no link to actual loss. As such type 1 risk assessments help the engineering process to secure a system, identifying which risk treatment should have the higher priority, but a type 1 risk assessment can neither justify the risk treatment investments or show compliance with regulations or quantitative corporate risk criteria.
Type 1 risk assessments are often conducted as qualitative risk assessments, a form of risk assessment that exclusively relies on the subject matter “opinion”. There is no statistical information used to assess a certain risk level.
Type 2 and type 3 risk is expressed as loss-based risk (LBR), a probability (event frequency) that a specific loss will occur. Working with LBR requires a quantitative or semi-quantitative method to estimate the risk because the risk tolerance criteria are normally specified as an event frequency.
A semi-quantitative method is the most popular choice because it is easier / less time-consuming than a fully quantitative risk assessment.
For example, the process safety discipline uses Layers Of Protection Analysis (LOPA) to determine which process safeguards are required to reduce the risk such that it meets the TMEL, LOPA is a semi-quantitative method. A semi-quantitative method mixes risk factors based on statistical data and risk factors based on subject matter judgment. When we choose a quantitative or semi-quantitative approach we need to work with a model of the risk absorbing system, and scenarios ( both cyber-attack scenarios as well as loss scenarios) to quantify risk.
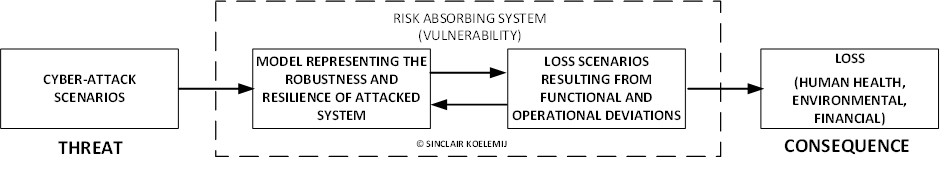
A successful cyber-attack scenario results in a functional deviation that triggers/enables the loss scenario. So we need to combine the cyber-attack consequence (functional deviation) from the cyber-attack scenario with the cause of the loss scenario and/or potential safeguards in place to prevent the loss. This combined scenario is called the extended scenario.
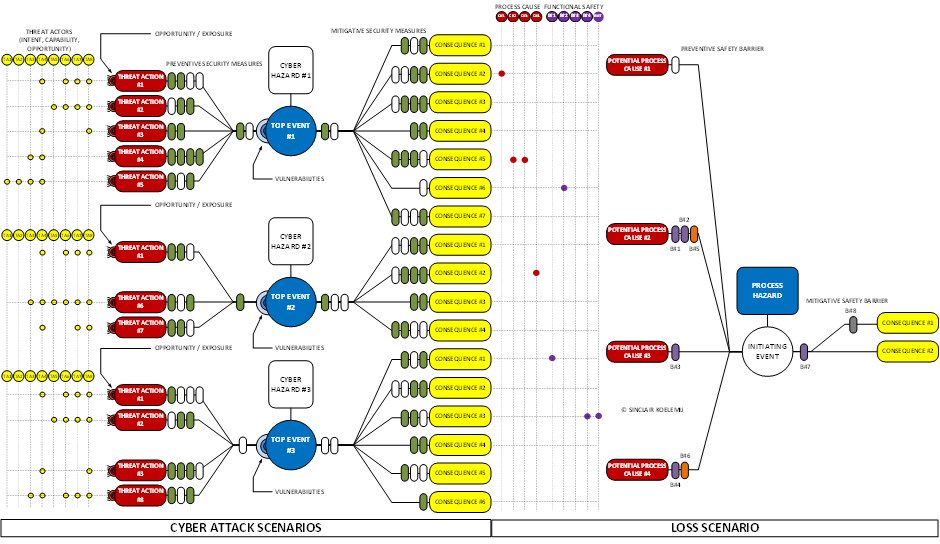
The above diagram provides an example of an extended scenario for cyber-physical risk (Type 2), but the business risk (Type 3) has a similar structure. On the left, we have 8 different threat actor profiles that perform the attack. Depending on the capabilities and opportunities of the threat actor, a specific threat action (TTP) is attempted. Threat actions target vulnerabilities, vulnerabilities that are protected with security measures. A security measure in the widest context, so design, configuration settings, and external solutions. A successful cyber-attack results in a consequence, a functional deviation of the process automation system. The system doesn’t do what it was designed to do or what the process operator expected. Some of these consequences can trigger the loss scenario and/or disrupt an electronic/programmable protection function, this could result in the loss.
Based on the model of the risk absorbing system (the process automation system) a success rate is estimated in the form of a mitigated event frequency (MEF). The MEF is a function of the threat actor profile, the initiating event frequency of the threat action (TTP), the static/dynamic exposure of the target (asset or channel), and the risk reduction (protection) created by the security measures.
This MEF, also called the mitigated event likelihood (MEL), needs to meet the TMEL criteria defined for the loss (See Figure 3 – Example risk criteria). A MEF or MEL is not the same as a probability, it is an event frequency. To convert an event frequency into a probability we need to define a time window, for example, 5 or 10 years, and calculate the probability that the event with a specific MEF/MEL will occur in that time window. When we have a probability value we can use this for what is called ROPA analysis.
So far the risk assessment method doesn’t differ that much from the LOPA method used for process safety risk, LOPA also estimates a MEF / MEL and compares this frequency with the TMEL to determine if more protection (lower probability of failure on demand (PFD)) is required. But there are a number of differences between process safety and cyber security that require additional steps, steps defined by the ROPA (Rings Of Protection Analysis) process I will discuss now.
Up to now the analysis considered individual targets (assets and channels the asset uses), among which a subset of targets that is directly connected with the physical part of the risk absorbing system a part that triggers the loss scenario. We simulated attacks against these targets/channels and determined the success rate/frequency of the various attack scenarios.
Based on the scenario and this frequency we can identify and add additional security measures to reduce the frequency to a level that meets the TMEL. However, there are many assets and channels used in process automation that do not meet the level of protection required to meet the TMEL of the cyber-physical loss scenario. For example field devices, controllers, PLCs, Modbus channels, Classic OPC channels, etc. All assets and channels that miss sufficient security controls to withstand a cyber-attack, though many of them can cause the activation of very serious cyber-physical loss scenarios.
These targets are the most critical targets when estimating cyber-physical risk, these targets might result in consequences for which regulations have specified a maximum event frequency similar as it did for process safety.
In a properly designed system, the threat actor most likely can’t reach these vulnerable assets and channels directly without using intermediate steps by attacking other assets and use these to further penetrate the system. Thus, these critical assets also depend on the security of features they rely on for data or access protection and to which they are connected over the network. This extra layer of assets forms a protective ring around the critical assets in order to intercept the attack before the threat actor can reach the critical asset or channel. This is one of the key design elements in a process automation system and is created by both network and application segmentation.
Understanding how these layers – rings of protection – contribute to risk reduction is called ROPA. In a ROPA we estimate the conditional probabilities, so a probability that depends on a prior action to succeed. Conditional probabilities are typically lower, so getting closer to the TMEL.
As I mentioned for working with probabilities it is necessary to convert the estimated event frequency into a probability. When we have the probability we can calculate the conditional probability and convert this back into an event frequency for comparison with the TMEL of the loss scenario.
When we do this we are actually extending the scenario by adding a new cyber-attack scenario in front of the extended scenario we analyzed.
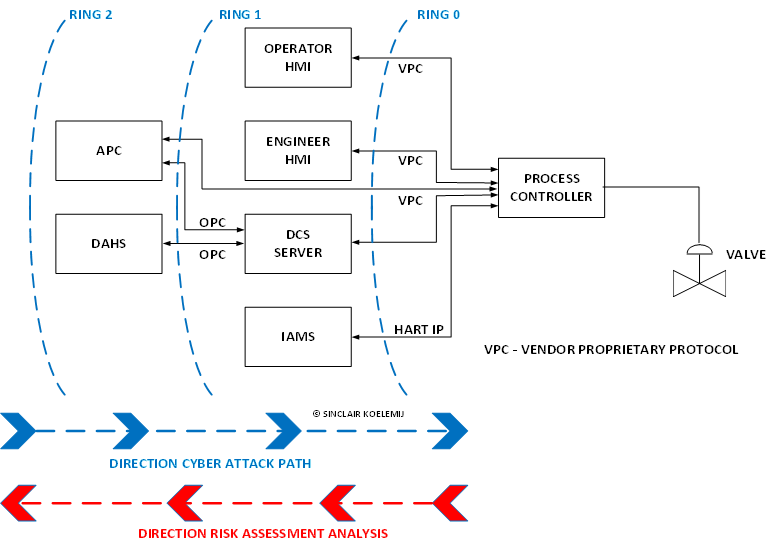
On the right-hand side we have our ultimate target, the valve we want to close. For example a cool water valve. The valve has in this case no network connection, it fully depends for its security on the process controller. The valve positioner could be a HART field instrument, so communicates through a super-imposed digital communication protocol on top of the 4-20 mA output signal with the controller or possibly an instrument asset management (IAMS) function.
The process controller uses a 4-20 mA analog signal to control the valve position, the super-imposed HART protocol allows an engineer to alter settings in the smart positioner of the valve or monitor diagnostic valve performance data.
So there are multiple attack scenarios and hazards to be considered for analyzing an attack on the positioner controlling the valve. For example a direct attack against the controller, or a direct attack against the instrument asset management function (IAMS) that possibly manages or monitors the positioner, or alternatively through an indirect attack on the engineering station or operator station, and possibly the DCS server. There are also different security measures available for the different threat actions / TTP, for example, configuration settings in both the process controller and the field instrument.
But even if all of these targets would be properly secured and met the TMEL criteria, the APC (Advanced Process Control) function communicating with the DCS server may be the cause or instead, the threat actor might attempt to manipulate the OPC channel communication.
So the chain created by the dependencies and connecting assets can be quite long and we need to analyze the conditional probability in this chain till we find a point where the resulting probability meets the TMEL requirement. It is like a game of chess where each potential move demands us to analyze what the opponent can do and consider the response to this. The number of combinations becomes quite high.
Therefore this type of analysis can only be conducted through developing specialized tools that allow modeling of the threat absorbing system in combination with a large repository of cyber-attack scenarios “stress testing” the model of the process automation system. A method is used that is called counterfactual risk analysis, a risk engine that allows us to search through all the possible scenario chains and estimate the event frequency.
Such a system provides us with risk results (quantitative residual risk in the form of an event frequency) for all scenarios (cyber-attack scenarios and extended scenarios) giving a detailed insight in risk, security measures, and defense in depth, inter-dependencies, connectivity, and loss. This method allows for analysis per threat actor profile, per process section, per process automation function (or its components), per TTP, etc. A result database with a wealth of security information that can be used to analyze and document the cyber security hazards from many different angles.
At present there are globally only very few cyber analyst service providers capable of this level of detailed risk analysis, also many asset owners (including standard organizations like ISA 62443) aren’t aware of the developments in risk analysis in the last 10 years. They still focus on high-level qualitative approaches that are not capable to show this level of detail and don’t provide the required mitigated event likelihood frequency to compare with the corporate risk criteria.
Those risk assessments become more of a checkbox item to meet compliance but seldom lead to new insights into the cyber-physical threat.
Semi-quantitative risk analysis has been applied in for example terrorism risk (very comparable with cyber risk) and food quality risk. Two risk domains where many thought for years that a (semi-) quantitative approach is not possible. Today it is an approach approved by regulatory bodies and has proven its value in many domains. Universities have developed powerful methods and researchers wrote many books on the topic. Still, there is a huge knowledge gap because I noticed that people whose cyber knowledge I respect very much were fully new to the semi-quantitative approach though at least two decades in use.
Cyber security starts with risk, and with every step we make we should be guided by how risk is influenced. Since risk has a very strong mathematical basis, we should take it seriously and stop treating it purely intuitively like many do. To properly secure a system we should understand which security measures really contribute to risk reduction and which are only marginal improvements. That requires detailed risk analysis and the results for a security measure differ per system.
Cyber-physical risk is important because if we consider today’s viable threats, the industry faces potential fatal incidents caused by cyber-attacks. So let’s stop surfing the waves of “solution hypes”, if we invest in a solution at least we should know which attack and loss scenarios are addressed by this investment and make sure we address the most critical first. Based upon a proper risk foundation.

A complimentary guide to the who`s who in industrial cybersecurity tech & solutions
Free DownloadRelated